How to Use This Site
A quick walkthrough of everything on Stocked Fish: Maine — the map and search on the
homepage, an individual waterbody's page, the Statewide Summary, finding waterbodies near an
address, and how to flag a problem if you spot one. For what the site is and where the data
comes from, see the About page.
1. Finding a Waterbody
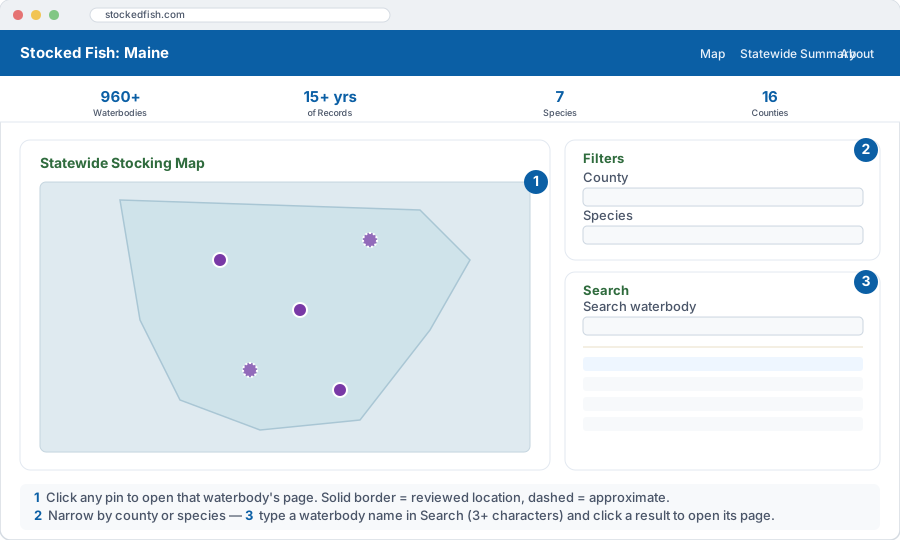
Diagram of the homepage layout — illustrative, not an exact screenshot of the live site.
-
The map shows every waterbody with a known location. Click any pin to
open that waterbody's page directly. A solid pin border means the
location has been reviewed and confirmed; a dashed border means it's
still an approximate placement.
-
County and Species filters narrow both the map and the search results
at once — pick a county, a species, or both.
-
Search by name in the box on the right. It needs at least 3 characters
before it starts matching (e.g. typing "seb" will find "Sebago Lake"). Click any result
to open its page.
Tip: the "What's New" and "Today in Stocking History" cards on the
homepage are worth a glance too — they surface recently-added events and what was
stocked on today's date in past years, without any searching required.
2. Reading a Waterbody's Page
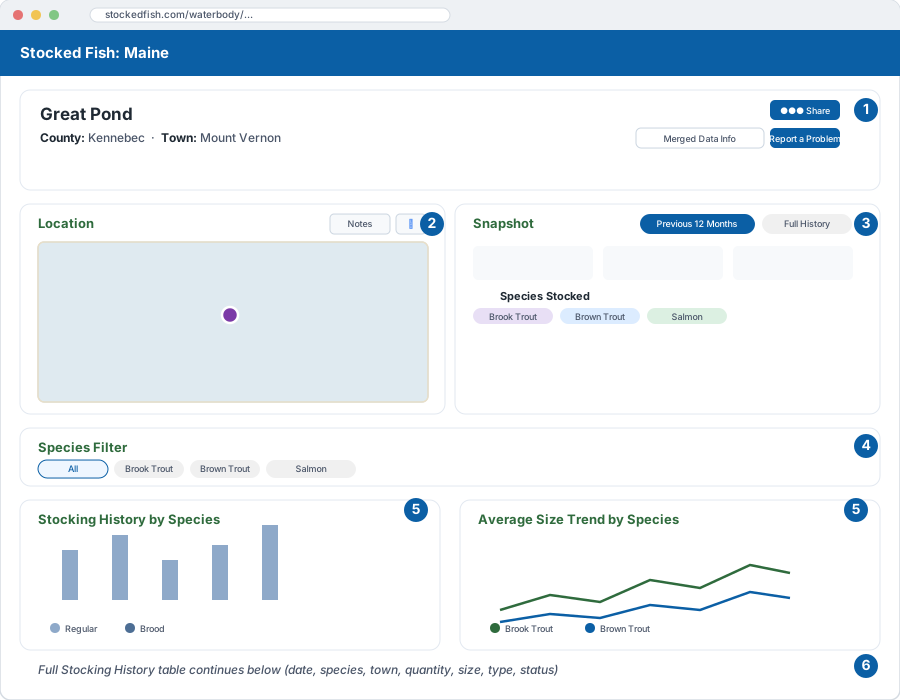
Diagram of a waterbody's page — illustrative, not an exact screenshot of the live site.
-
Header actions — Share copies a link to this
page (top right). Below it, Merged Data Info appears only when this
waterbody has other records merged into it, showing which year/name/county/town
combinations were combined; Report a Problem is always there next to it.
-
Report a Problem — found a wrong location, a missing event, or a
number that looks off? This button opens a short form right there on the page.
-
Location card — the mini map for this specific waterbody, a
Notes button (when the waterbody has one, with access info or naming
quirks), and a Google Maps icon that opens the same location externally.
-
Snapshot tabs — toggle between the Previous 12
Months and the Full History view of totals and species stocked.
Full History includes a date-range slider so you can zoom into any period on record.
-
Species Filter — click one or more species pills to narrow both
the Stocking History by Species chart and the Average Size Trend by Species chart down to
just those species (each chart has its own legend below it); leave none selected to see
all of them.
-
Full Stocking History table — every recorded event for this
waterbody: date, species, town, quantity, average size, stock type (Regular or Brood),
and status.
3. Exploring Statewide Trends
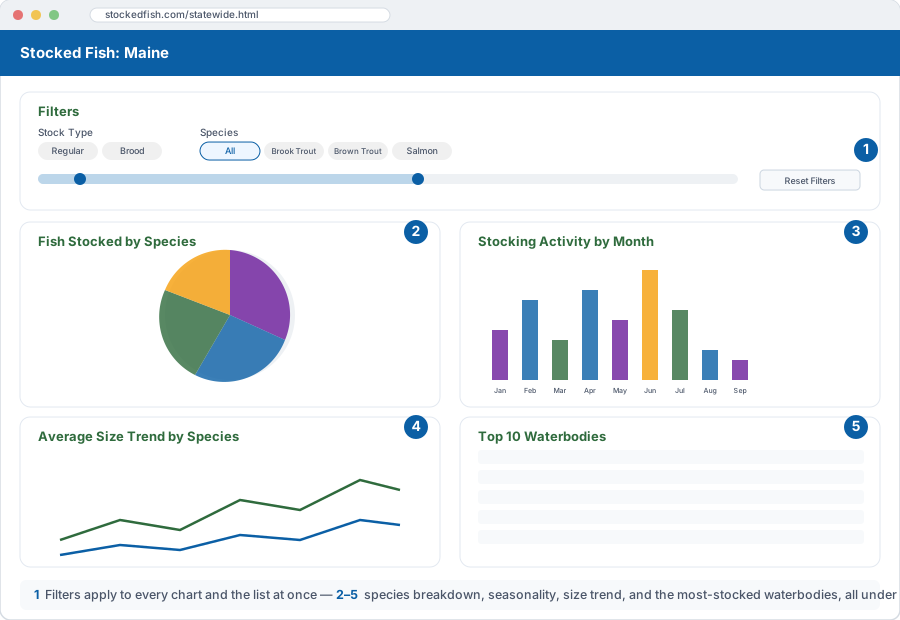
Diagram of the Statewide Summary page — illustrative, not an exact screenshot of the live site.
-
Filters — Stock Type and Species pills, plus a date-range slider,
all apply across every chart and the Top 10 list at the same time. Reset
Filters clears everything back to statewide, all-time.
-
Fish Stocked by Species — a breakdown of total quantity by species
under the current filters.
-
Stocking Activity by Month — every year on record collapsed into
one seasonal view, so you can see which months see the most stocking activity.
-
Average Size Trend — always shows every year on record (so the
trend line has enough data to be meaningful), but still respects the Species and Stock
Type filters.
-
Top 10 Waterbodies — the most heavily-stocked waterbodies under
the current filters. Click any one to open its own page.
4. Finding Waterbodies Near You
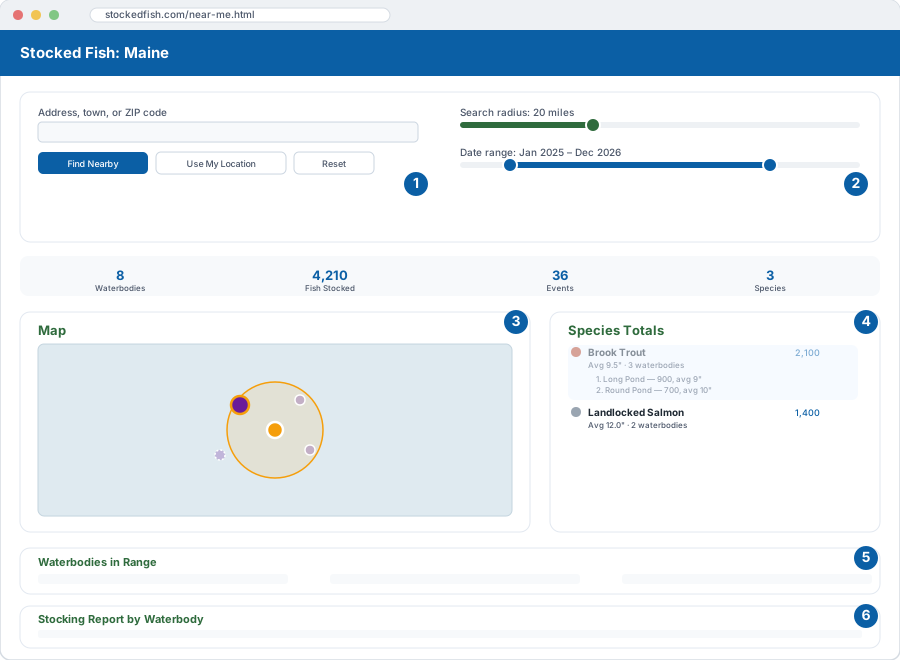
Diagram of the Near Me page — illustrative, not an exact screenshot of the live site.
-
Search — type an address, town, or ZIP code and click Find
Nearby, or click Use My Location to search from your browser's
current location instead. Reset clears the address and puts the radius
and date range back to their defaults.
-
Search radius — 5 to 50 miles, defaulting to 20. Date
range — the same dual-handle slider as Statewide Trends, defaulting to the
last two full calendar years. Changing either one automatically re-runs the search once
you release the slider.
-
Map — your searched location (orange), a circle showing the search
radius, and a purple pin for every waterbody found inside it (solid border = reviewed,
dashed = approximate, same as the homepage map).
-
Species Totals — total fish stocked by species across everything in
range, color-coded to match the Statewide Trends charts, with each species' top 3
waterbodies by quantity listed underneath it.
Click a species name to filter everything else on the page down to just
that species: the other species dim, the map markers for waterbodies with that species
get bigger and brighter while the rest fade, and both the Waterbodies in Range list and
the Stocking Report table below narrow to match. Click the same species again (or click a
different one) to change or clear the filter.
-
Waterbodies in Range — every matching waterbody, nearest first.
Click any one to open its full page.
-
Stocking Report by Waterbody — every waterbody-and-species
combination in range, with total quantity and average size (rounded to the nearest half
inch) for the selected date range.
Tip: distances are measured from each waterbody's general location pin,
the same one used everywhere else on the site — see
Data & Location Accuracy below.
5. Data & Location Accuracy
Stocking numbers come straight from Maine DIFW's published reports. Locations are a
different story: every pin and coordinate on this site marks the general location
of the waterbody itself — one pin per lake, pond, river, or stream —
not the specific spot where fish were released. That level of detail isn't in the source
reports, so it isn't shown here either. See the About page for
more on how locations get reviewed over time.
6. Reporting a Problem
- Open the waterbody's page where you spotted the issue.
- Click Report a Problem, near the top of the page.
-
Briefly describe what looks wrong — a misplaced pin, a missing or duplicate event,
an incorrect number, anything else — and click Send Report.
That's it — no account or contact info required to send a report.
 Stocked Fish: Maine